Re-hello everyone. Welcome to this new yet simple tutorial on how you can visualize your data from a database with Google Chart.
You probably know what Google chart is. In case you don't, it a JavaScript library which is used for data visualization in graphs. With it you will be able to interpret your data and see how it behaves. Let's take a scenario where one would need such technology. Imagine you have a website on which people can sign up and become members, like on Lancecourse. Every day, month, year I have a certain number of people who sign up. But actually all this users are in my database. It looks like having a lot eggs in a basket. If I could have a graph showing me how many people I get every month or year, side by side, it could be easier for me to understand how my user subscription and know when it went up or down, or remained constant. With that I can remain focused and keep an eye on my user base.
In this tutorial I will be using this scenario, fetch data(Users) from my database and feed google chart with it.
>> Check out the demo
Why is that so special?
You are probably right asking such question since Google Chart has been around for quite a while now. There is a whole lot of tips and tutorials on it out there.
Yes, you are indeed right. I am motivated by four reasons:
- Google chart is a javascript library
- We're going to work with PHP
- Google Chart data format is JSON and is very hard to define/handle
- Many people would like to use such thing to enhance their dashboards
When you work with one programming language, usually there is no issue in handling data format. But when it comes to combining two or more, data exchange between them becomes an important case. Although PHP and Javascript do handle JSON quite well, a format we'll be working with, serializing data from PHP and handing over to Google Chart is never easy.
Why Google Chart?
Hmm, that seems obvious since Google Chart has been around for a while, It's been used by many people and Google is a trusted firm in many technologies. Many companies have adopted it long ago. They will definitely be looking for people like you who are learning it.
Also, recently I was asked by two people how one can fetch data through Ajax for Google Chart. Although there are greater and more flexible JS libraries out there like D3, Dygraphs, etc which could be more flexible for data visualization, we will do this here with Google Chart. That way you will have more choices to do in your next project. Besides, the possibilities with Google Chart are unlimited.
How does it work
From Google, here is a very basic usage of Google Chart:
See the Pen Google Chart Sample by Ahmed (@zooboole) on CodePen.
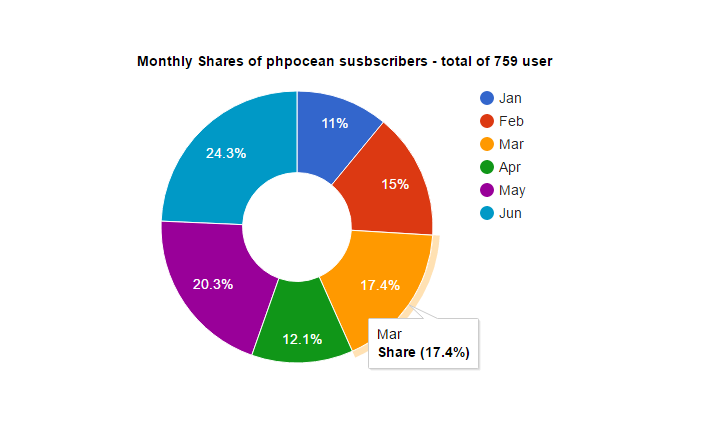
A very simple and interactive Pie Chart. Read more about this quick start
Here the main part to note are:
-
The
drawChart()method which passed to setOnLoadCallback() class. This, to make sure that whenever the Google Visualization API is loaded the chart drawing should start. Something like the way we load jQuery. -
The
DataTable()class used to provide JSON format data to the API -
Then the
PieChart()method used to specify the container of the chart. It also indicates the type of chart we want. In this example, a Pie Chat. This could be replaced by a bar chart, bubble chart, etc.
Basically it take three line to set it up:
<script type="text/javascript">

    // Load the Visualization API and the piechart package.
    google.charts.load('current', {'packages':['corechart']});

    // Set a callback to run when the Google Visualization API is loaded.
    google.charts.setOnLoadCallback(drawChart);

    // callback function
    function drawChart() {  };

</script>
Our goal here is to target the DataTable method. The data to provide must be coming from a database using PHP. Depending on the type of chart we want there is a specific format for it to adopt. In this example, I will be using the pie chart. The pie chart requires and object containing columns and rows as following:
Which could be represented like following with json:
{
  "cols": [
        {"id":"","label":"Topping","pattern":"","type":"string"},
        {"id":"","label":"Slices","pattern":"","type":"number"}
      ],
  "rows": [
        {"c":[{"v":"Mushrooms","f":null},{"v":3,"f":null}]},
        {"c":[{"v":"Onions","f":null},{"v":1,"f":null}]},
        {"c":[{"v":"Olives","f":null},{"v":1,"f":null}]},
        {"c":[{"v":"Zucchini","f":null},{"v":1,"f":null}]},
        {"c":[{"v":"Pepperoni","f":null},{"v":2,"f":null}]}
      ]
}
Example from google chart
We have to return such format of our data with the PHP script.
In order to do that, we will need to use jQuery. jQuery provide an $.ajax() method which can allow us to query a PHP script without reloading the page.
Our PHP script will use PDO(or any other method you want) to query a table in our database. Then it will serialize the data by formatting it as JSON and return it to jQuery. Let's do this.
- Create a folder and name it gchart.
- Create two files within it:
index.html
<!DOCTYPE html>
<html>
<head>
    <title>Google Chart with Ajax and PHP</title>
    <!--Load the AJAX API-->
    <script type="text/javascript" src="https://www.gstatic.com/charts/loader.js"></script>
    <!-- Load Jquery -->
    <script type="text/javascript" src="//ajax.googleapis.com/ajax/libs/jquery/1.10.2/jquery.min.js"></script>

    <!-- Make the chart -->
    <script type="text/javascript">

        // Load the Visualization API and the piechart package.
        google.charts.load('current', {'packages':['corechart']});

        // Set a callback to run when the Google Visualization API is loaded.
        google.charts.setOnLoadCallback(drawChart);

        function drawChart() {
          var jsonData = $.ajax({
              url: "getData.php",
              dataType: "json", // type of data we're expecting from server
              async: false // make true to avoid waiting for the request to be complete
              });

          // Create our data table out of JSON data loaded from server.
          var data = new google.visualization.DataTable(jsonData.responseText);

          // Instantiate and draw our chart, passing in some options.
          var chart = new google.visualization.PieChart(document.getElementById('chart'));

          var options = {
              title: 'Monthly Shares of Lancecourse susbscribers - total of 759 user',
              width: 800,
              height: 440,
              pieHole: 0.4,
            };

          chart.draw(data, options);
        };

      </script>

</head>
<body>
    <!--Div that will hold the chart-->
    <div id="chart"></div>
</body>
</html>
getData.php
<?php

// database settings
$db = null;
$db_engine = 'mysql';
$host = 'localhost';
$charset = 'utf8';

$db_user = 'YOUR_USER';
$db_password = 'YOUR_PASSWORD';
$db_base = 'YOUR_DATABASE';
$dsn = "mysql:host=$host;dbname=$db_base;charset=$charset";

// Connection to our database
try{

    $dsn = "mysql:host=$host;dbname=$db_base;charset=$charset";
    $options = [
        PDO::ATTR_ERRMODE            => PDO::ERRMODE_EXCEPTION,
        PDO::ATTR_DEFAULT_FETCH_MODE => PDO::FETCH_OBJ,
        PDO::ATTR_EMULATE_PREPARES   => true,
    ];
    $db = new PDO($dsn, $db_user, $db_password, $options);

}catch (PDOException $e){
     print(json_encode(array('outcome' => false, 'message' => 'Unable to connect')));
}

// Get all my users
function getFullListOfUsers($dbh)
{
    $request = $dbh->prepare( "SELECT * FROM it_users WHERE user_subs_time > 2015-12 OR user_subs_time <= 2016-12 " );
    return $request->execute() ?  $request->fetchAll() : null;
}

$users = getFullListOfUsers($db);

// I want data for just some months
$months = ['Jan' => 0, 'Feb' => 0, 'Mar' => 0, 'Apr' => 0, 'May' => 0, 'Jun' => 0];

// Look for subscribers for each month
foreach ($users as $user) {
    if (array_key_exists(date('M', $user->user_subs_time), $months)) {
        $months[date('M', $user->user_subs_time)] ++;
    }
}

// List of the chart rows
$rows = [];

// Create rows for each month
foreach ($months as $key => $value) {
     $rows[] =  ['c' =>
                        [
                          ['v' => $key],
                          ['v' => $value, 'f' => 'Share']
                        ]
                ];
}

// Structure data for google visualization API
$data = [

     'cols' => [
            ['1', 'Months', 'type' => 'string'],
            ['2',  'Subscriptions', 'type' => 'number']
      ],
      'rows' => $rows

];

header('Content-Type: application/json');
echo json_encode($data);
What happened?
Well, in order to get the JSON format about I have to create a similar array in my PHP code then serialized it with json_encode(); On top of that I used the header() to indicate the type of data the file returns.
My array looks like this:
$data = [

         'cols' => [
                ['1', 'Months', 'type' => 'string'],
                ['2',  'Subscriptions', 'type' => 'number']
          ],
          'rows' => $rows

    ];
Where the rows look like:
['c' =>
        [
          ['v' => 'monthName'],
          ['v' => 'numberUsersOfonth', 'f' => 'Share']
        ]
]
Since changing from array to JSON is a matter replacing {} with [] you should notice that this set of arrays I made are in the same order as the google DataTable() object.
Important points to have in mind
-- The keys cols, rows, c, v, f are specific and required.
-- Each row is an array containing a sub-array. This sub-array contains other sub-arrays which now correspond to your data columns each. So if your data table has two columns, you will have two sub-sub-arrays, if more columns, then more of them.
-- This data format is more specific to a pie chart. It's different in other types, like the bar chart.
-- Each chart type belongs to a package group defined by google.charts.load('current', {'packages':['corechart']}). Here you can see that the pie chart belongs to the corechart. This package is a kind if namespaceor library of functions.
Conclusion
The result is impressive. It's interesting to interact with data and make it express itself. Google Visualization API is indeed very powerful have so many options to use. This is just a simple way of using the pieChart(). Although this tutorial is focused on fetching data with ajax from a database, I am sure you can still dig more on other types of graphs.
For any other type of chart you want to work on, do not hesitate to check its API. It contains all the details on how the data should be formatted and what are the options you can apply.
I hope this adds something to your knowledge. If that's the case please share this with your peers.
Thanks for reading.
Cover image credit to www.dtelepathy.com
Last updated 2024-01-11 UTC